YUPITR Analytics
See what’s changing. Know what to do next.
Connect signals across your website, app, products, marketplaces, campaigns, competitors, and customers. YUPITR helps teams find the patterns behind performance, understand the evidence, and prepare the next decision.
From scattered signals to decisions you can inspect.
- Google Analytics
- Semrush
- Android
- iOS
- Competitors
Marketplaces · Demo data
TikTok Shop MX
Growing fast · +184% month over month
NET
$27K
GROSS
$73K
A single video by a creator the brand does not work with drove 412 units in nine days. The brand cannot edit it, cannot retire it and did not brief it, so the usual creative verbs do not apply here.
WHAT YOU CAN ACTUALLY MOVE HERE
The asset selling here is not yours to edit or retire.
Saves a draft for review. Nothing is approved or spent.
One connected view
A clearer picture of performance across your business.
Bring channel results, pipeline quality, product behavior, and customer signals into one analytical view, so teams can see where performance is moving and where the picture is still incomplete.
Compare what platforms report with the outcomes your business tracks. See which signals are connected, which require review, and where attribution or data coverage leaves uncertainty.
- Cross-channel performance
- Connected to business outcomes
- Evidence and coverage made visible
- Observed, estimated, and unlinked data clearly distinguished
Questions, grounded in context
Ask a business question. Follow the evidence.
Ask about a trend, channel, product, or customer journey. YUPITR retrieves relevant records from the workspace and shows what supports the answer and what remains uncertain.
Explore the matching evidence, see its source and status, and prepare a follow-up for review. An answer does not approve, publish, spend, or execute an action.
- Workspace-aware answers
- Evidence you can inspect
- Uncertainty stays visible
- Drafts remain drafts until reviewed
Which products have enough data to evaluate?
REALLOCATE CAPITAL · P1 · CRITICAL
Shift $1.2K budget from underperforming Commercial SMB Meta campaigns into Enterprise Experimental Testing.
Open Campaigns

The missing item for a customizable outfit matching your products
Effortlessly chic with comfort & breathability in mind at a price you can’t beat. Sign up for early access today!



Customized message per buyer persona
A governed analytics loop
Turn an insight into a decision, with people in control.
Move from evidence to a proposed action, human review, permitted execution, and outcome measurement. Each step can remain visible in the decision record.
- 1
Detect
Identify a meaningful change or opportunity.
- 2
Inspect
Review the evidence, sources, and uncertainty.
- 3
Prepare
Create a proposed action for review.
- 4
Decide
Approve, revise, or dismiss it.
- 5
Measure
Record what happened and what the evidence showed.
Recommendations are not execution. Review and permission come first.
Overview
Scenario finding
Synthetic · not externally verified
Why did conversion drop on mobile?
A checkout validation release explains most of the decline; a concurrent shift toward lower-intent paid traffic amplified it.
Driver signals
3
Evidence classes
4
Recommendations 3 listed
View all →PAID MEDIA · 89% confidence
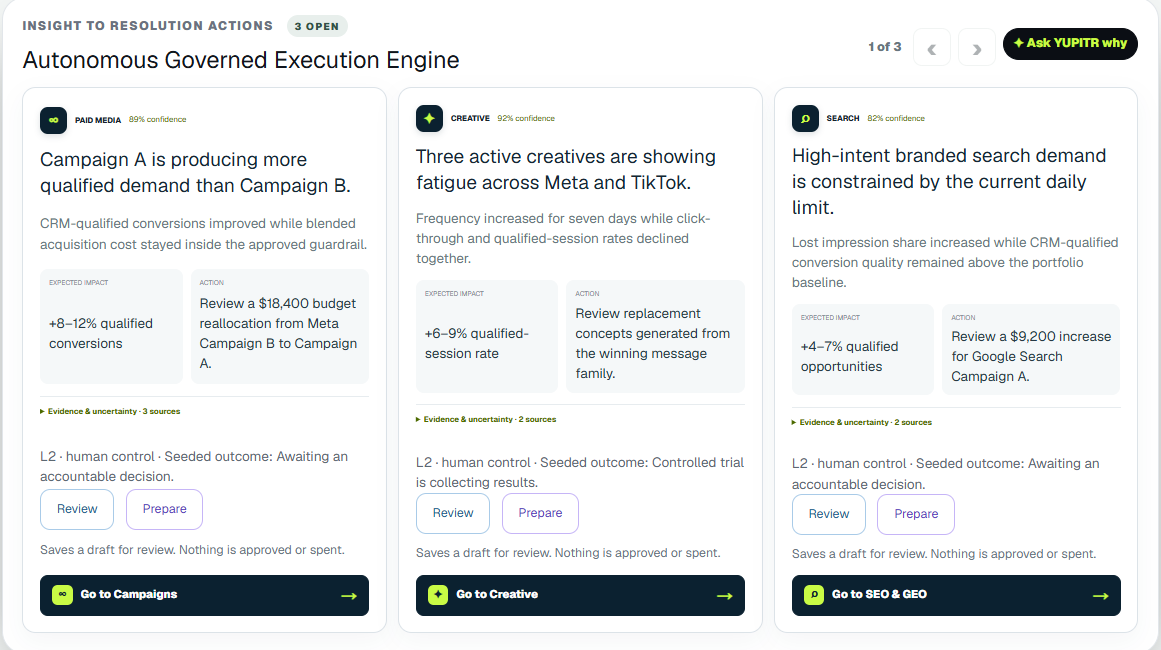
Campaign A is producing more qualified demand than Campaign B.
Review a $18,400 budget reallocation from Meta Campaign B to Campaign A. +8–12% qualified conversions
Awaiting an accountable decision. · Open Campaigns →
Market & Competitors
Macro telemetry pulse
4M AGO
48 Ingestion Feeds32ms Latency
Google Trends MX142k Prompts
Category benchmark scanSync 100%
◎ Top market signal
“Regulated fleets pay a 22% premium for a vendor that can produce an audit-ready compliance report; 82% of the category still cannot.”
Causal whitespace: Enterprise & Regulated
Strategic interceptions
Capture the uncaptured demand for audit-ready emissions reporting.
Saturation 8%Interception plan →
Customers
Today’s top insight · 94%
Post-sale delay in Monterrey exposes $240K of B2B lifetime value.
WhatsApp resolution is 3.4× faster; ownership transfer remains the causal bottleneck.
Open full evidence →
Active recommendations
3 URGENTDeploy support mitigation
Assign two senior agents and enable technical-inspection scheduling.
Protect top advocates
Prepare governed referral activation for the resolved Tier 1 cohort.
Verify voice shift
Trace electrical-reliability language across 1,420 governed conversations.
Marketplaces
An authorised distributor undercut the brand
−$32,400 estimated contribution over 14 days · Mercado Libre
PrepareSaves a draft for review. Nothing is approved or spent.
A hero product runs out mid-flight
−$8,400 estimated wasted spend · Cross-platform
PrepareSaves a draft for review. Nothing is approved or spent.
Seller standing
01
Detect
02
Inspect
03
Prepare
04
Decide
05
Measure
Understand the experience
Find the friction behind the funnel.
Follow the journey from first visit to repeat use. See where users progress, where they hesitate, and which product or app experiences may deserve closer attention.
Analyze channel volume alongside direct conversion, diagnose funnel drop-off, review feature adoption and retention, and monitor app-store presence and component health. Low-volume areas should be treated as unmeasured, not automatically as failures.
- Funnel and drop-off diagnostics
- Product usage and retention
- Feature health and adoption
- Sample-size awareness
Net promoter score
62+6 pts
vs previous month
Promoters: 74% · Detractors: 12%
Average sentiment
78.4%+3.2%
Favorable sentiment
68% Positive · 21% Neutral · 11% Critical
Direct advocacy
34.2%+4.1%
New referred prospects
1 in 3 closes comes from a referral
Active pain point #1
Technical-delivery delay
32% mentions negative
Wait: 4.8 days (SLA: 24h)
First response time
18 min−12 min
Overall acceleration
WA: 4m · Mail: 2.8h · 91% identity
Logistics & Last Mile
Tier 1 B2B · Region: Monterrey, Apodaca & Pesquería
Cohort NPS
78
Renewal rate
96%
Time to close
18 days
High-performance driver
High satisfaction is driven by preventive-maintenance bundling and under-two-hour express response for maneuvering-yard requests.
“On-site operational support prevented three line stoppages this quarter. WhatsApp response speed is unmatched.”
Mixed Commercial
SMB / Retail · Region: Santa Catarina & Saltillo
Cohort NPS
24
Churn risk
28%
Open tickets
48 active
Severe friction detected
Severe friction caused by poor visibility into municipal CFE procedures and opaque common-maintenance fees during the first month of occupancy.
! Urgent review required: 14 commercial contracts expire within 60 days without a renewal request.
Look beyond gross sales
Understand what each product and marketplace really contributes.
Compare product and channel performance using the signals that shape the economics: net contribution, fees, fulfillment, returns, inventory, and marketplace position.
Surface potential margin leaks, products that need more evidence, inventory risks, and marketplace-specific constraints. Prepare a recommendation for review without implying that YUPITR changed a listing, budget, or marketplace account.
- Net contribution, not just gross sales
- Returns, fees, and fulfillment
- Inventory-aware recommendations
- Unmeasured is not underperforming
Catalogue by cluster
441 SKUs in total

Footwear cluster [LLM]
100 listings in total
Net margin
12.4%13%4%
Net revenue
$15,23416%5%
Units sold
161,17011%8%

Activewear cluster [LLM]
84 listings in total
Net margin
9.6%12%2%
Net revenue
$10,20412%2%
Units sold
249,74010%9%

Accessories cluster [LLM]
57 listings in total
Net margin
14.0%5%3%
Net revenue
$19,6049%9%
Units sold
552,14313%9%
Footwear cluster [LLM]
100 listings in total
Net margin
12.4%13%4%
Net revenue
$15,23416%5%
Units sold
161,17011%8%
See the market move
Connect market signals to your next strategic question.
Bring together campaign performance, category demand, segment economics, and changes observed in permitted public sources.
Explore how demand and competitive activity may be changing, compare opportunity across segments, and identify areas that may warrant investigation. A detected public-page change is an observation, not proof of its commercial impact or intent.
- Campaign and channel contribution
- Market and category signals
- Segment opportunity and economics
- Public-source changes with context
- Observation is not attribution
Macro Demand Dynamics: CLTV vs. CAC & Velocity Matrix
Cross-analysis of customer lifetime value (CLTV), acquisition cost and sales-cycle velocity by segment
Regulated fleet compliance
High opportunity / low CAC
$850KBase CLTV
CAC: Very low ($1.8K)
Sales cycle: 1.4 months92% B2B satisfaction
Multi-site mid-market operators
Accelerated growth
$140KBase CLTV
CAC: Medium ($3.2K)
Sales cycle: 2.8 monthsExpansion traction
Owner-operator starter tracking
Margin risk
$65KBase CLTV
CAC: High ($5.8K)
Sales cycle: 6.2 monthsChannel saturation
Legacy on-premise telematics
Efficiency leakage
$95KBase CLTV
CAC: Very high ($9.4K)
Sales cycle: 11.4 monthsCategory decline
Capital allocation rules
3.8xAverage CLTV/CAC Ratio
Corporate budget is moving to vendors with explicit compliance commitments and an implementation under nine months.
- Green: High opportunity / scale B2B media
- Blue: Accelerated growth / capture contracts
- Amber: Margin risk / reduce spend
- Red: Efficiency leakage / divest
Calculations supported by first-party CRM and category benchmarks
Understand the customer journey
Find the moments that build loyalty or create friction.
Bring journey behavior, customer feedback, sentiment, advocacy, and service signals together to identify where the experience is working and where customers may need attention.
Explore sentiment by touchpoint, common reasons customers recommend or complain, cohort-level health, and potential retention risks. Keep the source, time period, sample, and confidence visible so teams can judge what a signal means.
- Journey-level customer signals
- Sentiment and advocacy drivers
- Friction and retention risks
- Cohorts, sources, and confidence

Customer Signal
Scoring Breakdown
Simulated customers · not a live audience
Customer Simulator
“Feels more human”
“Increased CLTV by 7%”
Buyer Persona Segment #2
Warmer light, less symmetry, and clearer product entry.
Built for careful decisions
Know what the data says, and what it doesn’t.
YUPITR should make evidence, coverage, source status, and uncertainty visible so teams can distinguish an observation from an inference or a projection.
- 01
Show sources and relevant time periods.
- 02
Distinguish observed, estimated, synthetic, and simulated information.
- 03
Make missing or unlinked data visible.
- 04
Keep human review and permissions in the decision path.
- 05
Do not present a projected impact as a measured result.
Confidence is useful only when you can see what it is based on.
Start with a business question
See the signal. Inspect the evidence. Decide what happens next.
Explore how YUPITR connects analytics to a reviewable, measurable decision process.
Analytics that helps your team move from “what changed?” to “what should we review next?”